EV Charger Installation Cost by State
Two identical chargers, two identical garages, one in Little Rock and one in Portland. The hardware costs the same; the electrician does not. Here is every state, from one BLS table, with the arithmetic done.
How this is funded: we earn a commission if you buy through our links, at no extra cost to you. It never changes which product we recommend, and we’ll tell you when we’d skip one. Full disclosure.
Every install-cost article ends the same way: “it depends where you live.” That is true and useless, so here is the whole country worked out. The charger on the wall costs the same in Arkansas as it does in Oregon. The person who runs the circuit does not, and on a typical job that person is the largest line on the bill.
The wage column below is the Bureau of Labor Statistics’ own published mean hourly wage for electricians (SOC 47-2111) in each state, from the May 2025 Occupational Employment and Wage Statistics survey. Everything else in the table is ours, computed in code from that wage so the assumptions and the output cannot drift apart.
The method, stated plainly
There is no authoritative national dataset of EV charger installation prices by state. Rather than invent one, we index a real number by another real number:
- Take our national range for the electrical work — labor plus materials for a new 240V circuit, excluding the charger, the permit and any panel upgrade. That range is $300–$1,200, the same figure we publish in the full cost breakdown.
- Take BLS’s mean hourly electrician wage for the state and divide it by the national mean of $34.37. That gives a labor index — 0.75 in Arkansas, 1.40 in Oregon.
- Multiply the range by the index, and round to the nearest ten dollars.
- For the all-in column, add a $450 charger (the midpoint of our published $250–$700 hardware band) and a $150 permit (the midpoint of $50–$300).
That is the entire model, run 51 times. It is an estimate and it says so. What it is good for is walking into a quote already knowing whether the number you have been handed is normal for where you live.
| State | Electrician wage ($/hr) | vs U.S. | Electrical work | All-in, no panel upgrade |
|---|---|---|---|---|
| U.S. average | 34.37 | 1.00× | $300–$1,200 | $900–$1,800 |
| AlabamaEast South Central | 27.65 | 0.80× | $240–$970 | $840–$1,570 |
| AlaskaPacific Noncontiguous | 43.29 | 1.26× | $380–$1,510 | $980–$2,110 |
| ArizonaMountain | 30.88 | 0.90× | $270–$1,080 | $870–$1,680 |
| ArkansasWest South Central | 25.71 | 0.75× | $220–$900 | $820–$1,500 |
| CaliforniaPacific Contiguous | 41.28 | 1.20× | $360–$1,440 | $960–$2,040 |
| ColoradoMountain | 31.88 | 0.93× | $280–$1,110 | $880–$1,710 |
| ConnecticutNew England | 37.21 | 1.08× | $320–$1,300 | $920–$1,900 |
| DelawareSouth Atlantic | 34.02 | 0.99× | $300–$1,190 | $900–$1,790 |
| District of ColumbiaSouth Atlantic | 42.72 | 1.24× | $370–$1,490 | $970–$2,090 |
| FloridaSouth Atlantic | 27.72 | 0.81× | $240–$970 | $840–$1,570 |
| GeorgiaSouth Atlantic | 29.37 | 0.85× | $260–$1,030 | $860–$1,630 |
| HawaiiPacific Noncontiguous | 44.65 | 1.30× | $390–$1,560 | $990–$2,160 |
| IdahoMountain | 32.02 | 0.93× | $280–$1,120 | $880–$1,720 |
| IllinoisEast North Central | 44.34 | 1.29× | $390–$1,550 | $990–$2,150 |
| IndianaEast North Central | 34.05 | 0.99× | $300–$1,190 | $900–$1,790 |
| IowaWest North Central | 30.38 | 0.88× | $270–$1,060 | $870–$1,660 |
| KansasWest North Central | 33.27 | 0.97× | $290–$1,160 | $890–$1,760 |
| KentuckyEast South Central | 29.52 | 0.86× | $260–$1,030 | $860–$1,630 |
| LouisianaWest South Central | 29.98 | 0.87× | $260–$1,050 | $860–$1,650 |
| MaineNew England | 37.14 | 1.08× | $320–$1,300 | $920–$1,900 |
| MarylandSouth Atlantic | 36.28 | 1.06× | $320–$1,270 | $920–$1,870 |
| MassachusettsNew England | 39.21 | 1.14× | $340–$1,370 | $940–$1,970 |
| MichiganEast North Central | 35.50 | 1.03× | $310–$1,240 | $910–$1,840 |
| MinnesotaWest North Central | 38.86 | 1.13× | $340–$1,360 | $940–$1,960 |
| MississippiEast South Central | 27.88 | 0.81× | $240–$970 | $840–$1,570 |
| MissouriWest North Central | 34.77 | 1.01× | $300–$1,210 | $900–$1,810 |
| MontanaMountain | 34.58 | 1.01× | $300–$1,210 | $900–$1,810 |
| NebraskaWest North Central | 30.75 | 0.89× | $270–$1,070 | $870–$1,670 |
| NevadaMountain | 36.40 | 1.06× | $320–$1,270 | $920–$1,870 |
| New HampshireNew England | 31.63 | 0.92× | $280–$1,100 | $880–$1,700 |
| New JerseyMiddle Atlantic | 41.68 | 1.21× | $360–$1,460 | $960–$2,060 |
| New MexicoMountain | 28.66 | 0.83× | $250–$1,000 | $850–$1,600 |
| New YorkMiddle Atlantic | 40.80 | 1.19× | $360–$1,420 | $960–$2,020 |
| North CarolinaSouth Atlantic | 27.33 | 0.80× | $240–$950 | $840–$1,550 |
| North DakotaWest North Central | 33.87 | 0.99× | $300–$1,180 | $900–$1,780 |
| OhioEast North Central | 33.09 | 0.96× | $290–$1,160 | $890–$1,760 |
| OklahomaWest South Central | 30.49 | 0.89× | $270–$1,060 | $870–$1,660 |
| OregonPacific Contiguous | 47.96 | 1.40× | $420–$1,670 | $1,020–$2,270 |
| PennsylvaniaMiddle Atlantic | 36.43 | 1.06× | $320–$1,270 | $920–$1,870 |
| Rhode IslandNew England | 35.65 | 1.04× | $310–$1,240 | $910–$1,840 |
| South CarolinaSouth Atlantic | 28.38 | 0.83× | $250–$990 | $850–$1,590 |
| South DakotaWest North Central | 29.80 | 0.87× | $260–$1,040 | $860–$1,640 |
| TennesseeEast South Central | 30.55 | 0.89× | $270–$1,070 | $870–$1,670 |
| TexasWest South Central | 28.50 | 0.83× | $250–$1,000 | $850–$1,600 |
| UtahMountain | 31.39 | 0.91× | $270–$1,100 | $870–$1,700 |
| VermontNew England | 35.27 | 1.03× | $310–$1,230 | $910–$1,830 |
| VirginiaSouth Atlantic | 32.62 | 0.95× | $280–$1,140 | $880–$1,740 |
| WashingtonPacific Contiguous | 45.42 | 1.32× | $400–$1,590 | $1,000–$2,190 |
| West VirginiaSouth Atlantic | 32.61 | 0.95× | $280–$1,140 | $880–$1,740 |
| WisconsinEast North Central | 35.49 | 1.03× | $310–$1,240 | $910–$1,840 |
| WyomingMountain | 35.99 | 1.05× | $310–$1,260 | $910–$1,860 |
What the spread actually means
The national mean is $34.37 an hour. The lowest state, Arkansas at $25.71, sits about 25% below it; the highest, Oregon at $47.96, about 40% above. End to end that is a spread of roughly 1.9 to 1 — substantial, but notably tighter than the four-to-one spread in what the electricity itself costs, which we map in charging cost by state. Labor varies less than power does.
The regional pattern is not the one people expect. The Pacific Contiguous and Pacific Noncontiguous states are uniformly expensive — Oregon, Washington, Hawaii, Alaska and California all above $41 — but so is Illinois at $44.34, well clear of its East North Central neighbors. The South Atlantic and East South Central states cluster low, with North Carolina, Alabama, Florida, Mississippi and South Carolina all under $29. And the Mountain region is genuinely mid-pack: Nevada at $36.40 and Wyoming at $35.99 sit above the national mean, while New Mexico at $28.66 sits well below it.
The practical read: in a low-wage state the electrical work is a modest fraction of the job and the charger you choose is the bigger decision. In a high-wage state the reverse is true — the labor line dominates, which is exactly where shortening the wiring run and avoiding a panel upgrade earn the most money back.
Four things this table does not know
1. Your panel. The single largest cost wildcard is not in the table at all. If your service cannot spare the capacity, a panel or service upgrade adds roughly $1,000–$3,000 or more, and it scales with the same local labor rate — so an expensive state is expensive twice. Work through panel capacity before you budget anything, and read load management before you agree to an upgrade, because a load manager sometimes replaces one outright.
2. Your wiring run. A charger on the wall beside the panel and a charger across a finished house are different jobs at the same hourly rate. Distance, conduit, wall construction, an outdoor run or a detached garage that needs trenching all move the hours, and hours are what the wage index multiplies. This is why the range within a state is wider than the difference between most states.
3. Your local permit fee. Permit and inspection costs are set by thousands of individual jurisdictions, not by states, and no one publishes them centrally. We use a flat $150 midpoint in the all-in column; your city may charge $50 or it may charge $300. It is still not optional — permits and inspection explains what the fee actually buys.
4. Your rebates. The table is gross cost, before any program pays part of it back. DOE’s Alternative Fuels Data Center lists 114 utilities offering a residential Level 2 charger purchase rebate and 74 offering an installation rebate. Those land directly on the hardware and electrical-work lines here, and in a state with a strong program the net number can be materially lower. Nearly all of them require you to apply before the work happens — see utility rebates and tax credits and rebates for how to find yours.
Two figures worth knowing before you call anyone
BLS puts 757,220 electricians in employment nationally, at a median annual wage of $63,190 and a mean of $71,490. That matters for a reason that is not obvious: a mean hourly wage is what the electrician earns, not what you are billed. A contractor’s billed rate carries overhead, insurance, the truck, the licence and the margin on top, and typically lands at something like two to three times the technician’s wage. We are not using the wage as a billing rate here — we are using it as an index, because the multiplier is roughly constant across states and cancels out of the comparison. What survives is the geography, which is the part you cannot control.
The second figure: charging is a continuous load under NEC Article 625, so the circuit is sized at 125% of the charger’s output. A 40-amp charger needs a 50-amp circuit and a 48-amp charger needs a 60-amp one. That rule, not your state, is what decides the wire and breaker your electrician quotes — wire size and breaker sizing turns it into a table.
Where this changes what you should buy
In a high-wage state, buying a charger you can dial down is worth real money, because the cheapest install is the one that fits the circuit you already have. In a low-wage state that argument is weaker and the hardware decision dominates. Either way, an ENERGY STAR listing is frequently an eligibility condition for the rebates above, and it also cuts standby draw on a unit that sits energized around 22 hours a day.
Quick picks
Ranked on published specs, charging speed, electrical fit and value. Select a row to jump to the full write-up. We have not bench-tested these chargers — here is exactly what we do instead.
| # | Product | Best for | Price |
|---|---|---|---|
| 1 | 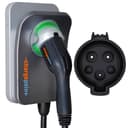 ChargePoint Home Flex The safest default for most homes: you set the amperage in the app to 16, 24, 32, 40, 48 or 50A, so one charger fits whatever circuit your panel can spare today and scales up if you upgrade later. The app is the most mature here, firmware arrives over the air, and the warranty is long. | Best for a tight or uncertain circuit | $528.00 · View on Amazon Price as of September 7, 2026. #ad How we’re funded |
| 2 |  Emporia Level 2 EV Charger The value pick that doesn't feel cheap: a full 48 amps, ENERGY STAR listing, WiFi with genuine energy monitoring, and a 25 ft cable — for well under what the big names charge. It's the one we point most people to first. | Best value 48A, hardwired or plug-in | $449.00 · View on Amazon Price as of September 7, 2026. #ad How we’re funded |
| 3 | 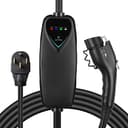 Lectron 40A Portable Level 2 Charger One of the cheapest honest ways into real Level 2 charging. Plug it into a NEMA 14-50 outlet, get a genuine 40A / 9.6 kW, and unplug it to take on a trip. No app and a shorter warranty are the trade-offs for the price. | Cheapest route if a 14-50 already exists | $269.99 · View on Amazon Price as of September 7, 2026. #ad How we’re funded |
If a NEMA 14-50 outlet is already on the garage wall, most of this table stops applying to you — a plug-in charger turns the job into a purchase. If it is not, the honest next step is hiring the electrician, with this page open so you can tell a normal quote from an optimistic one.
General guidance, not electrical advice. Level Two Club is written by an EV-charging enthusiast, not a licensed electrician. A Level 2 charger runs on a 240V circuit; hardwiring, breaker sizing and load calculations must follow the National Electrical Code and your local code, and a permitted install is done by (or inspected for) a licensed electrician. Use our numbers to plan the conversation, not to skip it.
Frequently asked questions
Which states are cheapest for EV charger installation?
On BLS's May 2025 wage data the cheapest electrician labor is in Arkansas ($25.71/hr mean), North Carolina ($27.33), Alabama ($27.65), Florida ($27.72) and Mississippi ($27.88) — all around a fifth below the $34.37 national mean. Scaling our national $300-$1,200 electrical-work range by that gives roughly $220-$900 for the electrical side in Arkansas, against $300-$1,200 nationally.
Which states are most expensive for EV charger installation?
Oregon leads at $47.96 an hour, then Washington at $45.42, Hawaii at $44.65, Illinois at $44.34 and Alaska at $43.29 — about 1.3 to 1.4 times the national mean. In Oregon that scales our national electrical-work range to roughly $420-$1,670. The spread from Arkansas to Oregon is about 1.9 to 1, which is real but far smaller than the four-to-one spread in what electricity costs by state.
Is this table a quote?
No, and it can't be. It is a wage-indexed estimate: BLS's published mean hourly wage for electricians in your state, applied to the national cost range we publish for the electrical work. It does not know your panel, your wiring run, your wall construction or your local permit fee. The only real number comes from a licensed electrician who has seen your panel — this table tells you what a reasonable quote should look like before you get one.
Why use electrician wages instead of published state install prices?
Because no authority publishes state-by-state EV charger installation prices, and we won't invent them. Electrician wages are published by the Bureau of Labor Statistics for every state on a documented survey, and labor is the single largest variable line on an install bill. Indexing our national range by a real, citable wage figure is the most honest state-level estimate available.
Does a panel upgrade change these numbers?
Completely, which is why it sits outside the table. A service or panel upgrade adds roughly $1,000-$3,000 or more and is the one line that turns a routine job into a project. It also scales with local labor, so a state in the expensive column pays more for that too. Check your panel capacity before you budget anything else.
Do state or utility rebates come off these figures?
Often, yes. DOE's Alternative Fuels Data Center lists 114 utilities offering a residential Level 2 charger purchase rebate and 74 offering an installation rebate. A charger rebate lands on the hardware line and an installation rebate on the electrical-work line, so in a state with a generous program the real net cost can fall well below the ranges here. Most programs require you to apply before the work is done.
Sources
- U.S. Bureau of Labor Statistics — Occupational Employment and Wage Statistics, Electricians (47-2111) — BLS's official May 2025 OEWS estimates for electricians (SOC 47-2111): 757,220 employed nationally, mean hourly wage $34.37, mean annual wage $71,490 and median annual wage $63,190. The state-level mean hourly wages used in our table were pulled series by series from the BLS public data API (api.bls.gov/publicAPI/v2, OEWS state series for occupation 47-2111, data type 03 'hourly mean wage', survey year 2025) on the date accessed, covering all 50 states and the District of Columbia (accessed September 3, 2026)
- NFPA — Using the Latest NEC for EV Charger Installations — NFPA on NEC (NFPA 70) Article 625: EV charging is a continuous load, so circuits are sized to 125% of load (the 80% rule) (accessed July 19, 2026)
- U.S. DOE Alternative Fuels Data Center — Charging Electric Vehicles at Home — US DOE on home EV charging: most owners charge overnight on Level 1 or Level 2, installs follow NEC Article 625, with example home-charging costs (accessed July 19, 2026)
- U.S. DOE Alternative Fuels Data Center — Utility Incentives — DOE's catalog of utility incentives by customer type: 114 utilities listed offering residential Level 2 charging station purchase rebates and 74 offering Level 2 installation rebates, plus make-ready/pre-wiring rebates, managed-charging programs and EV time-of-use rates. RE-READ September 3, 2026: the residential counts were unchanged at 114 participating utilities for the EV Level 2 Charging Station Purchase Rebate and 74 for the EV Level 2 Charging Station Installation Rebate, alongside 17 for the Make-Ready or Pre-Wiring Rebate for EV Chargers, 109 for the EV Time-of-Use (TOU) Rate and 9 for the EV Managed Charging Program (accessed September 3, 2026)
- ENERGY STAR — Electric Vehicle Chargers — ENERGY STAR on EVSE efficiency: certified chargers use about 40% less energy in standby than non-certified units (accessed July 19, 2026)
Keep reading
The full cost breakdown
The national picture this table scales: hardware, labor, breaker, permit and the panel-upgrade wildcard, line by line.
See the breakdownPanel capacity
The one line item that sits outside this table and can double the bill. Check it before you budget.
Check your panelHiring the electrician
How to read the quotes this table is meant to sanity-check, and the five questions to ask before you sign one.
Vet your installerUtility rebates
114 utilities rebate the charger and 74 the installation. How to find yours in ten minutes — before the work starts.
Find your rebateCharging cost by state
The other state-by-state number: what the electricity itself costs once the charger is on the wall.
See charging costsPermits & inspection
The small non-optional line in the all-in column, and what the inspection actually buys you.
Read about permits