EV Charging Cost by State
Two identical cars on identical chargers, one in Boise and one in Honolulu. One owner pays about 3.5 cents a mile; the other pays nearly 15. Here is every state, from the same EIA table, with the arithmetic done.
How this is funded: we earn a commission if you buy through our links, at no extra cost to you. It never changes which product we recommend, and we’ll tell you when we’d skip one. Full disclosure.
Every cost-to-charge article eventually says “it depends on your electricity rate.” That is true and completely unhelpful, because almost nobody knows their rate off the top of their head. So here is the whole country, from one authoritative table, with the arithmetic already done.
The numbers below come from the U.S. Energy Information Administration’s Electric Power Monthly, the official monthly series for average electricity prices by state and sector. The rate column is EIA’s; every dollar figure is ours, computed in code from that rate so the assumptions and the output cannot drift apart.
The formula, in one line
Charging cost is not complicated: kWh × price per kWh. To turn that into a per-mile figure you divide the price per kWh by the car’s efficiency in miles per kWh. We use 3.5 miles per kWhas a reference for a mid-size EV throughout this site — your own figure is on the vehicle’s efficiency label, which DOE and EPA publish as kWh per 100 miles.
So a state at 20 cents per kWh costs about 5.7 cents a mile. A state at 30 costs about 8.6. That is the entire model, and everything below is that sum run 51 times.
| State | Rate (¢/kWh) | Full 60 kWh charge | Per 100 miles | Per mile |
|---|---|---|---|---|
| U.S. average | 18.44 | $11.06 | $5.27 | 5.3¢ |
| AlabamaEast South Central | 16.77 | $10.06 | $4.79 | 4.8¢ |
| AlaskaPacific Noncontiguous | 28.23 | $16.94 | $8.07 | 8.1¢ |
| ArizonaMountain | 15.23 | $9.14 | $4.35 | 4.4¢ |
| ArkansasWest South Central | 14.36 | $8.62 | $4.10 | 4.1¢ |
| CaliforniaPacific Contiguous | 33.25 | $19.95 | $9.50 | 9.5¢ |
| ColoradoMountain | 16.16 | $9.70 | $4.62 | 4.6¢ |
| ConnecticutNew England | 27.37 | $16.42 | $7.82 | 7.8¢ |
| DelawareSouth Atlantic | 19.38 | $11.63 | $5.54 | 5.5¢ |
| District of ColumbiaSouth Atlantic | 25.40 | $15.24 | $7.26 | 7.3¢ |
| FloridaSouth Atlantic | 15.17 | $9.10 | $4.33 | 4.3¢ |
| GeorgiaSouth Atlantic | 15.84 | $9.50 | $4.53 | 4.5¢ |
| HawaiiPacific Noncontiguous | 52.00 | $31.20 | $14.86 | 14.9¢ |
| IdahoMountain | 12.35 | $7.41 | $3.53 | 3.5¢ |
| IllinoisEast North Central | 23.85 | $14.31 | $6.81 | 6.8¢ |
| IndianaEast North Central | 18.15 | $10.89 | $5.19 | 5.2¢ |
| IowaWest North Central | 14.14 | $8.48 | $4.04 | 4.0¢ |
| KansasWest North Central | 15.13 | $9.08 | $4.32 | 4.3¢ |
| KentuckyEast South Central | 14.98 | $8.99 | $4.28 | 4.3¢ |
| LouisianaWest South Central | 14.15 | $8.49 | $4.04 | 4.0¢ |
| MaineNew England | 28.63 | $17.18 | $8.18 | 8.2¢ |
| MarylandSouth Atlantic | 21.77 | $13.06 | $6.22 | 6.2¢ |
| MassachusettsNew England | 28.82 | $17.29 | $8.23 | 8.2¢ |
| MichiganEast North Central | 22.01 | $13.21 | $6.29 | 6.3¢ |
| MinnesotaWest North Central | 16.95 | $10.17 | $4.84 | 4.8¢ |
| MississippiEast South Central | 16.16 | $9.70 | $4.62 | 4.6¢ |
| MissouriWest North Central | 13.68 | $8.21 | $3.91 | 3.9¢ |
| MontanaMountain | 14.67 | $8.80 | $4.19 | 4.2¢ |
| NebraskaWest North Central | 13.59 | $8.15 | $3.88 | 3.9¢ |
| NevadaMountain | 13.60 | $8.16 | $3.89 | 3.9¢ |
| New HampshireNew England | 27.33 | $16.40 | $7.81 | 7.8¢ |
| New JerseyMiddle Atlantic | 23.27 | $13.96 | $6.65 | 6.6¢ |
| New MexicoMountain | 14.12 | $8.47 | $4.03 | 4.0¢ |
| New YorkMiddle Atlantic | 29.93 | $17.96 | $8.55 | 8.6¢ |
| North CarolinaSouth Atlantic | 15.09 | $9.05 | $4.31 | 4.3¢ |
| North DakotaWest North Central | 13.61 | $8.17 | $3.89 | 3.9¢ |
| OhioEast North Central | 19.52 | $11.71 | $5.58 | 5.6¢ |
| OklahomaWest South Central | 13.38 | $8.03 | $3.82 | 3.8¢ |
| OregonPacific Contiguous | 16.27 | $9.76 | $4.65 | 4.6¢ |
| PennsylvaniaMiddle Atlantic | 21.55 | $12.93 | $6.16 | 6.2¢ |
| Rhode IslandNew England | 29.46 | $17.68 | $8.42 | 8.4¢ |
| South CarolinaSouth Atlantic | 16.18 | $9.71 | $4.62 | 4.6¢ |
| South DakotaWest North Central | 15.73 | $9.44 | $4.49 | 4.5¢ |
| TennesseeEast South Central | 14.47 | $8.68 | $4.13 | 4.1¢ |
| TexasWest South Central | 16.44 | $9.86 | $4.70 | 4.7¢ |
| UtahMountain | 12.96 | $7.78 | $3.70 | 3.7¢ |
| VermontNew England | 24.89 | $14.93 | $7.11 | 7.1¢ |
| VirginiaSouth Atlantic | 17.61 | $10.57 | $5.03 | 5.0¢ |
| WashingtonPacific Contiguous | 14.95 | $8.97 | $4.27 | 4.3¢ |
| West VirginiaSouth Atlantic | 16.80 | $10.08 | $4.80 | 4.8¢ |
| WisconsinEast North Central | 19.74 | $11.84 | $5.64 | 5.6¢ |
| WyomingMountain | 14.80 | $8.88 | $4.23 | 4.2¢ |
What the spread actually means
The national residential average in May 2026 was 18.44 cents per kWh. The cheapest state, Idaho at 12.35, is about a third below it; the most expensive, Hawaii at 52.00, is nearly three times it. That is a four-fold spread between the two ends, on the same car, on the same charger, for the same miles.
A few patterns are worth noticing rather than just reading off the table. New England and the Middle Atlantic cluster high — five of the six New England states are above 24 cents. The Mountain and West North Central regions cluster low, with Idaho, Utah, Oklahoma, Nebraska, North Dakota and Missouri all under 14. The South Atlantic splits sharply: North Carolina and Florida sit near 15, while Maryland and the District of Columbia are above 21. And the Pacific region is not one thing at all — Washington at 14.95 and California at 33.25 are in the same census division.
Even at the expensive end, the comparison that matters is not against other states. It is against a fuel pump, and we work that comparison through in EV charging vs gas. Hawaii is the only state where the arithmetic gets genuinely close.
Three reasons your bill will not match the table
A state average blends every utility in the state.EIA’s figure is exactly what it says: an average across all residential customers. In states with many utilities, an individual co-op or municipal provider can sit several cents either side of it.
Time-of-use rates are often much cheaper overnight.EIA notes that some utilities offer time-of-day pricing to reduce peak demand, and that the real cost of supplying electricity is highest in the afternoon and early evening even where customers pay a flat seasonal average. If your utility offers an EV or whole-home TOU plan, an overnight charging window can be billed well below the state average — which is the point of our time-of-use guide.
Tiered rates punish the extra consumption.Where a utility bills in tiers, an EV’s added kilowatt-hours land on top of your existing usage and may be priced at the highest tier you reach. That makes the marginal rate — not the average — the number that governs your charging cost. We take that apart in what an EV adds to your bill.
Where this changes what you should buy
The charger you bolt to the wall does not change your rate. It changes when you draw power, and in an expensive state that is worth money.
Run the sum: 12,000 miles a year at 3.5 miles per kWh is about 3,430 kWh. In Massachusetts at 28.82 cents that is roughly $988 a year. If a time-of-use plan halves the overnight rate, the saving is in the hundreds — enough to pay for the charger in a year or two. In Idaho the same driving costs about $423, and halving part of that saves considerably less.
That is the honest way to decide whether to pay for scheduling. Two caveats before you do: many EVs schedule charging perfectly well from the car’s own app, which makes a charger’s scheduler redundant — we argue both sides in smart vs dumb chargers. And an ENERGY STAR listing is frequently an eligibility condition for utility rebates, which can be worth more than a year of the savings you are optimizing.
Quick picks
Ranked on published specs, charging speed, electrical fit and value. Select a row to jump to the full write-up. We have not bench-tested these chargers — here is exactly what we do instead.
| # | Product | Best for | Price |
|---|---|---|---|
| 1 | 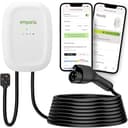 Emporia Level 2 EV Charger The value pick that doesn't feel cheap: a full 48 amps, ENERGY STAR listing, WiFi with genuine energy monitoring, and a 25 ft cable — for well under what the big names charge. It's the one we point most people to first. | Best value scheduler for a high-rate state | |
| 2 | 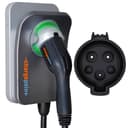 ChargePoint Home Flex The safest default for most homes: you set the amperage in the app to 16, 24, 32, 40, 48 or 50A, so one charger fits whatever circuit your panel can spare today and scales up if you upgrade later. The app is the most mature here, firmware arrives over the air, and the warranty is long. | Most mature scheduling app | $516.71 · View on Amazon Price as of October 18, 2026. #ad How we’re funded |
| 3 | 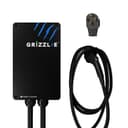 Grizzl-E Classic A deliberately dumb charger, and that is the point: no app, no cloud account, no firmware to fail — just a die-cast aluminum box built for a Canadian winter and rated to keep working outdoors. It went missing from Amazon for most of September 2026 and is listed again as of our 2026-09-28 check. If you want the same build with a WiFi radio in it, that is the Classic Connect. | Cheap-power states, where scheduling earns least |
A note on what is not in the table
These figures are energy delivered to the battery. They exclude three things, all of which are real:
- Charging losses, roughly 10% between the meter and the pack. Multiply by about 1.1 for the utility-billed number.
- Fixed charges— the monthly connection fee on your bill does not change because you bought an EV, so it does not belong in a per-mile figure.
- Winter, which is not a rounding error. DOE and EPA data put the range hit at around 41% in mixed driving at 20°F with the cabin heater running, and every one of those miles is electricity you paid for. We do that arithmetic separately in winter charging cost.
Once you have your own rate off your own bill, the rest of the site’s cost work applies directly: cost by battery size for your specific pack, and is a Level 2 charger worth it for whether the hardware pays for itself at that rate.
Frequently asked questions
Which state is cheapest to charge an EV in?
On EIA's May 2026 residential averages, Idaho at 12.35 cents per kWh, followed by Utah at 12.96 and Oklahoma at 13.38. At our reference efficiency of 3.5 miles per kWh, Idaho works out to about 3.5 cents per mile — roughly a tenth of what a 30-mpg gas car costs to run at $3.50 a gallon.
Which state is most expensive to charge an EV in?
Hawaii, by a wide margin: 52.00 cents per kWh in May 2026, about 2.8 times the national average of 18.44. California is next at 33.25, then New York at 29.93 and Rhode Island at 29.46. In Hawaii a 60 kWh charge costs about $31, against roughly $7 in Idaho.
Is the state average the rate I'll actually pay?
Usually not, and the gap can be large. A state average blends every utility and every rate plan in that state, including tiered rates that get more expensive as you use more. If your utility offers a time-of-use or EV rate, overnight charging is often billed well below the state average — sometimes at half of it. Your own bill's price per kWh is the only number that is really yours.
Does a more expensive state change which charger I should buy?
It changes the value of scheduling, not the value of speed. In a state above about 25 cents per kWh, being able to force every session into an off-peak window is worth real money each year, which argues for a charger with a scheduler or a car that has one. Below about 15 cents the scheduling premium is much harder to justify.
Do charging losses make these numbers optimistic?
Slightly, and deliberately so — the table shows energy delivered to the battery. Level 2 charging typically loses around 10% between the meter and the pack, so multiply any figure here by about 1.1 to get what the utility actually bills you. On a 60 kWh charge at the national average that is roughly a dollar.
How often do these prices change?
EIA publishes the table monthly and the figures move with fuel costs and season — prices are usually highest in summer. Treat the ranking as stable and the absolute numbers as a snapshot; the state you live in will not overtake or fall behind its neighbors quickly, but the cents can drift several points across a year.
Sources
- U.S. Energy Information Administration — Electric Power Monthly, Table 5.6.A — EIA's official state-by-state average price of electricity to ultimate customers by end-use sector, May 2026: US residential average 18.44 cents per kWh, from 12.35 in Idaho to 52.00 in Hawaii (accessed August 18, 2026)
- U.S. Energy Information Administration — Electricity prices and factors affecting prices — EIA on US electricity pricing: residential electricity averaged 17.30 cents per kWh in 2025; some utilities offer time-of-day pricing to reduce peak demand; prices are usually highest in summer, and the cost to supply electricity is higher in the afternoon and early-evening peak hours even though most customers pay a seasonal average rate (accessed August 11, 2026)
- FuelEconomy.gov — Electric Vehicles: Learn More About the Label — DOE/EPA on EV efficiency: kWh per 100 miles and MPGe, accounting for AC charging losses (accessed July 19, 2026)
- FuelEconomy.gov — Save Money (U.S. DOE / EPA) — The official DOE/EPA calculator comparing vehicle fuel costs, including EV electricity price per kWh (accessed July 19, 2026)
- U.S. DOE Alternative Fuels Data Center — Charging Electric Vehicles at Home — US DOE on home EV charging: most owners charge overnight on Level 1 or Level 2, installs follow NEC Article 625, with example home-charging costs (accessed July 19, 2026)
Keep reading
The cost-to-charge method
Where these numbers come from — the formula, worked slowly, with a calculator for your own rate.
See the mathTime-of-use rates
The single biggest lever on your charging bill, and the reason your state average may not apply to you.
Read about TOUCharging vs filling up
Cost per mile against a comparable gas car — and the states where the gap narrows.
Compare with gasRebates from your utility
The same company that sets your rate often pays part of your charger bill. How to find the program.
Find your rebate